Following a very difficult 2022, 2023 has proven to be similarly challenging, but thanks to the last few weeks is shaping up to deliver some OK returns.
Inflation is falling around the world, no big recession is yet to hit, energy prices are reasonable – what could go wrong!
Our fixed income funds have been rising steadily since July and equity markets have rallied sharply in recent weeks, turning what looked set to be a flat, no return year at the end of October into something more positive with just a couple of weeks left.
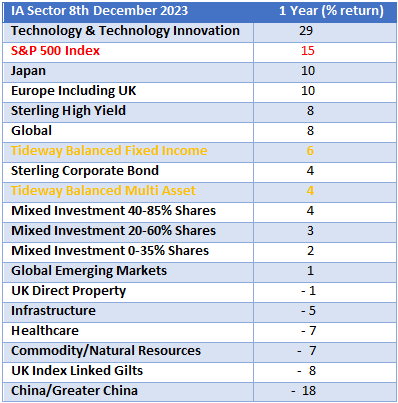
On a good year bad year basis, it’s been a good year for technology stocks, European and Japanese equities, high yield fixed income and Sterling.
It’s been a bad year for China, healthcare companies, index linked gilts (again), infrastructure, property, and active equity fund managers, who have generally all struggled to keep pace with the equity indices.
Here below are a selection of average fund sector returns (without advice or platform fees) for the last 12 months according to FE Analytics, along with Tideway’s Balanced Multi Asset and Fixed Income portfolios (after all Tideway and other fees) and the S&P 500 index in sterling.
We will do a 2024 outlook piece in early January with our thoughts on where we go from here.
Anecdotally, Ursula and I recently took a lift to the ‘Look Out’ on the 50th floor of the newly completed 8 Bishopsgate. If you can bear to move to the windows, it is queasily high, you can look down on the old NatWest Tower, formerly the highest building in London and up at the even taller 22 Bishopsgate at 278m high, where there will soon be the opportunity to dine in Europe’s highest restaurant. A conversation with the 8 Bishopsgate security team revealed that across the 50 floors there were just two tenants. I’m sure there is a plan, but I am very glad we have zero exposure to city office commercial property! There is clearly still some adjustment taking place to the new cost of money and post pandemic hybrid working.
To Track the Index or Invest Actively in Equities?
In the second quarter of the year we sold one of our active US equity fund managers, who had repeatedly failed to match index returns and bought the S&P 500 index instead. In doing so we have captured an 11% return in the last 6 months and its quickly become our top performing fund.
We have been debating ever since whether to buy more of the index but have resisted. At the heart of our decision not to add further to the index holding are our concerns over concentration and valuations.
Historically buying an index tracking fund offered the opportunity for a diverse investment into a wide range of companies at low cost. In the last few years this has been steadily changing.
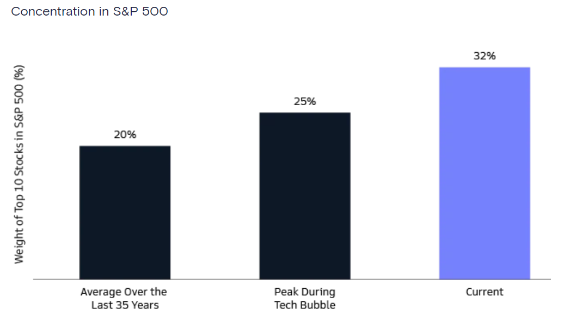
It does not really matter now whether you buy the Nasdaq index, the S&P 500 index or the MSCI World Index – all three indices are now dominated by a handful of US mega cap stocks, loosely described as tech stocks. We are familiar with the names.
Apple, Microsoft, Alphabet, Amazon, Nvidia, Meta and Tesla – the magnificent seven, collectively make up 44% of the Nasdaq index, 28% of the S&P 500 index and 19% of the MSCI world index.
Microsoft and Apple alone now represent almost 15% of the S&P 500 index. The share price performance of these two companies over the coming months and years will dominate the returns on these indexes.
Apple and Microsoft are now worth collectively $8.33 trillion. To put this into context, according to the London Stock Exchange, the top 100 UK listed companies combined have a value of just $2.4 trillion, less than a third of the value of these two companies.
A Deeper Look at Apple
Apple generates revenue of around $380billion. Apple’s revenue fell in its 2023 financial year by around 3% versus its record 2022 results, yet Apple’s share price has risen by around 50% so far this year, with Apple now valued at almost 32 times its last years’ earnings.
According to data published by FullRatio, Apple’s average price to earnings ratio for the last decade is 19 times, putting Apple’s current valuation around 68% above its average value relative to earnings in the last 10 years. To sustain its share price at an average price to earnings ratio of 19 over the last 10 years and during a period of very low interest rates, Apple managed to quadruple its revenues and maintain a 20% plus profit margin.
According to employment experts Zippia, Apple’s revenues already equate to an average of c$800 per year for every adult on the planet in the top 10% of high earners, earning $100,000 per year or more, around 500 million people.
1. Can Apple push its revenues to over $3,000 per year for every high-income adult on the planet and push its revenue to $1.5 trillion?
2. Can Apple maintain a profit margin of 20% plus indefinitely?
3. Will investors continue to pay 60% more than average for Apple shares in a period when interest rates are c 4 times higher than they have been in the last 10 years?
One out of three may be possible, 3 out of 3 looks highly unlikely.
Diversifying From the Magnificent Seven and The Index
We have three strategies for diversifying away from the index, which we think lowers risks and increases our return outlook going forwards.
In quick summary:
1. ‘Quality Growth’ – global active managers, typified by our Heriot Global and Fidelity European managers. Their portfolios may include one or two of the magnificent seven, but they will include relatively smaller companies on more attractive valuations. Their weightings per company will also be more evenly spread, they don’t invest on a market cap basis.
2. ‘Value Investing’ – again global active management to select unloved companies with good prospects as typified by our Schroder equity funds. The average price earnings ratio in these funds is nearer 10 times earnings. They are buying companies at a third of the price of Apple, many of whom will have solid and improving fundamentals.
3. ‘Specialist Sectors’ – this can be either be an active approach or passive where we can look to invest away from the US mega caps in other countries, smaller companies, or away from the tech sector.
We will look at each of these in more detail next year.
- The content of this document is for information purposes only and should not be construed as financial advice.
- Please be aware that the value of investments, and the income you may receive from them, cannot be guaranteed and may fall as well as rise.
- We always recommend that you seek professional regulated financial advice before investing.